Measurement Process
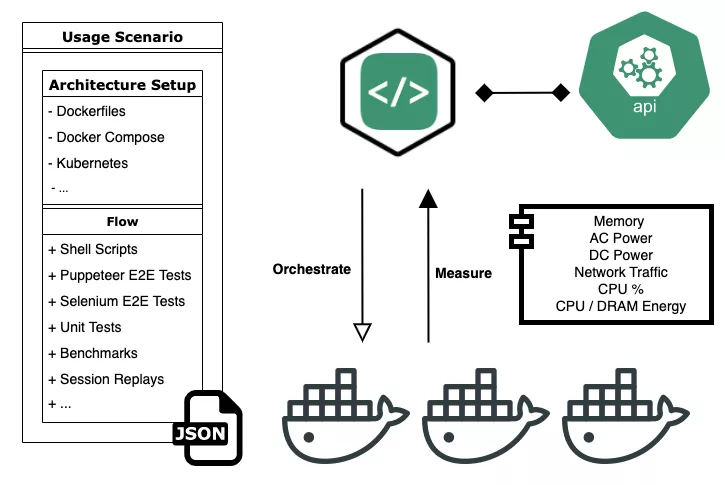
The Green Metrics Tool can orchestrate your application by consuming
what we call the usage_scenario.yml →.
This files includes your architecture specification as well as the flow of how to
interact with the application.
After orchestrating all the services with their respective containers,
the Green Metrics Tool attaches the Metric Providers → to the containers.
The Metric Providers → are modular plugins
that query a certain metric source, such as the CPU energy, DRAM energy, machine power, network traffic etc.

General Measurement Workflow#
A general workflow of a measurement is as follows:
- The repository is checked out
- The usage_scenario.yml → file is read and processed
- Docker images are pulled or built locally with Kaniko
- Networks are created according to the networks part in the usage_scenario.yml →
- Containers are orchestrated and connected to each other according to the services part in the usage_scenario.yml →
- During the Boot phase there is an attaching of the Metric Providers →
- During the Runtime phase, the flow part of the usage_scenario.yml → is run. This part of the
usage-scenario.yml contains the commands that are executed on the containers.- This can be:
- A Web browser interacting with the webserver container
- a simple terminal command to execute a machine learning application in a container
- simulated clicks / keyboard entries to interact with a Desktop application in a container
- Network simulation tests where containers are added / removed to provoke certain behavior or failure
- etc.
- The measurement is divided into phases, briefly covered in this high level overview
- After the flow the data from the Metric Providers → is collected and parsed
- Saving all to the database and running formatting / aggregations
