SCI (Green Software Foundation)
How to measure the Green Software Foundation's SCI metric with the Green Metrics Tool
Since version v0.18 the Green Metrics Tool can measure the Green Software Foundation’s SCI
The metric is essentially a Carbon per Unit of work metric and thus is very flexible in it’s application. Supplemental to the various metric providers that the Green Metrics Tool support this introduces not only the concept of total energy / carbon per usage_scenario, but also the concept of work done.
Setup
The parts to derive the metric have to be defined in two places:
- The
usage_scenario.yml(which sets the dimension R_d) - The
config.yml, which sets the machine specific parameters like TE, RS etc.
The actual ticks for the unit of work (R) are captured from the containers and processes STDOUT. This has to be activated by setting log-stdout and read-sci-stdout to True.
Setup in usage_scenario
Please see an example how to configure in our example applications repository for SCI apps.
A simple integration for an CLI based application might for instance look like this:
...
sci:
  R_d: calculated prime number
  # defined as the Carbon intensity per event that sysbench produces

flow:
  - name: Stress
    container: gcb-alpine-sysbench
    commands:
      - type: console
        note: Starting sysbench
        command: sysbench --cpu-max-prime=25000 --threads=1 --time=3 --test=cpu run --events=0 --rate=0 --debug=off | gawk '/total number of events:/{print "GMT_SCI_R="$NF}'
        shell: sh
        log-stdout: True
        log-stderr: True
        read-sci-stdout: True
As you can see we directly parse the output of a CLI command and the output the variable GMT_SCI_R=… to STDOUT.
If you have an API or similar the output might not happen on the CLI directly, but rather inside a node script or similar.
Setup in config.yml
An example configuration for the config.yml is provided when the Green Metrics Tool is installed.
The values for the respective variables have to be either defined to best knowledge (like lifetime for instance) and / or
from official databases like:
- https://dataviz.boavizta.org/manufacturerdata
- https://tco.exploresurface.com/sustainability/calculator
- https://www.delltechnologies.com/asset/en-us/products/servers/technical-support/Full_LCA_Dell_R740.pdf
Example:
sci:
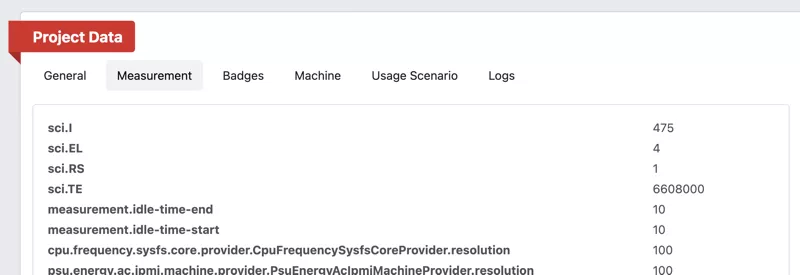
    EL: 4 # means 4 years of usage
    RS: 1 # means we use 1/1 = 100% of the machine. Bare metal. No virtualization
    TE: 181000 # Example value for a laptop taken from https://dataviz.boavizta.org/terminalimpact. Value is in g
    I: 436 # The number 436 that comes as default is for Germany from 2022. Value in gCO2e/kWh
Display
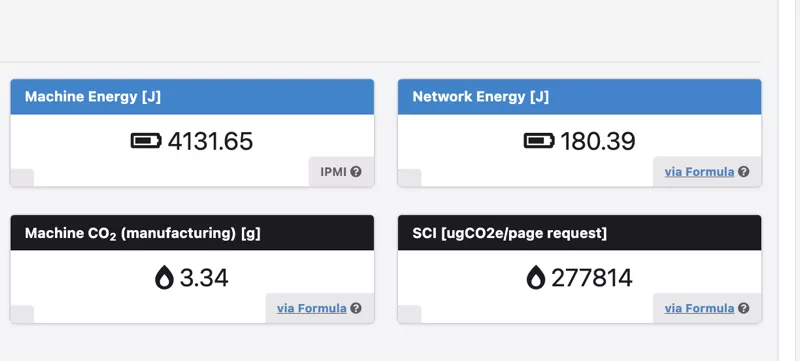
The metric will atm only be calculated for the RUNTIME phase and be shown in the Dashboard.

If an SCI was configured also the parameters will be shown in the Measurements Tab.

Formula
The SCI formula is specified by the Green Software Foundation
The components of the SCI are attributed by the GMT as follows:
- E: The energy of the total machine + the energy of the network.
- A PSU Energy provider must be activated to populate this value with the machine energy like PSU Energy XGBoost, PSU Energy MCP etc.
- If none is activated machine energy will be excluded from the SCI.
- A Network IO provider must be activated to populate this value with the network energy.
- If none is activated network energy will be excluded from the SCI.
- A PSU Energy provider must be activated to populate this value with the machine energy like PSU Energy XGBoost, PSU Energy MCP etc.
- I: Configured in the
config.yml. Set the intensity of your used grid location - M: Configured in the
config.yml. Set the embodied carbon of your used machine
Example applications
We provide quite some example applications that showcase how the SCI can be measured with the Green Metrics Tool for APIs, CLI tools etc.
Example applications on GitHub
Caveats and future work
At the moment the SCI is only measured in the RUNTIME phase and no sub-phase measurement is possible.
Future work will include making the SCI an actual Metric Provider and thus allowing to capture it in every phase, optionally with having different dimensions per phase even.
The work on this task is tracked in this GitHub Issue. We would love to get some contributions on this if you are willing to help :)