Measuring locally
Before starting to measure you must first install some prerequisites. See Installation on Linux →, Installation on macOS → or Installation on Windows (WSL) →
Make sure your Docker containers are up and running.
If they are not, you can start them by running docker compose up
whilst in the Green Metrics Tool docker subfolder.
If you came here from interacting with applications → then
you can also directly use your usage_scenario.yml.
Otherwise we will set it up here.
Measuring a simple example load
We will make the most basic example our tool can handle:
- Using alpine base container.
- Add the package
stress-ngfromapk - Just run a 5 seconds stress run with default metrics providers
So let’s start by going to the install folder of the Green Metrics Tool on your system
and then preparing the usage_scenario.yml:
cd PATH_TO_GREEN_METRICS_TOOL/docker
docker compose up -d
cd /tmp
mkdir easiest-application
cd easiest-application
touch usage_scenario.yml
git init .
git add .
git commit -m "All prepared for the energy test"
Now please copy the following code inside the usage_scenario.yml.
name: Stress Example
author: Arne Tarara <arne@green-coding.io>
description: Stress container on one core for 5 seconds

services:
  simple-load-container:
    image: alpine
    setup-commands:
      - command: apk add stress-ng

flow:
  - name: Stress
    container: simple-load-container
    commands:
      - type: console
        command: stress-ng -c 1 -t 5 -q
        note: Starting Stress
Under flow you see that we are just calling stress-ng -c 1 -t 5,
which will stress our CPU for 5 seconds on one core.
cd PATH_TO_GREEN_METRICS_TOOL
python3 runner.py --uri /tmp/easiest-application --name testing-my-demo
You should see an example output like so:
Having usage scenario ....
....
....
Please access your report with the ID: XXXX-XXXX ...
Now you can view the report as the first item in your metrics dashboard at http://metrics.green-coding.internal:9142/index.html
Cron mode / Cluster-Client mode
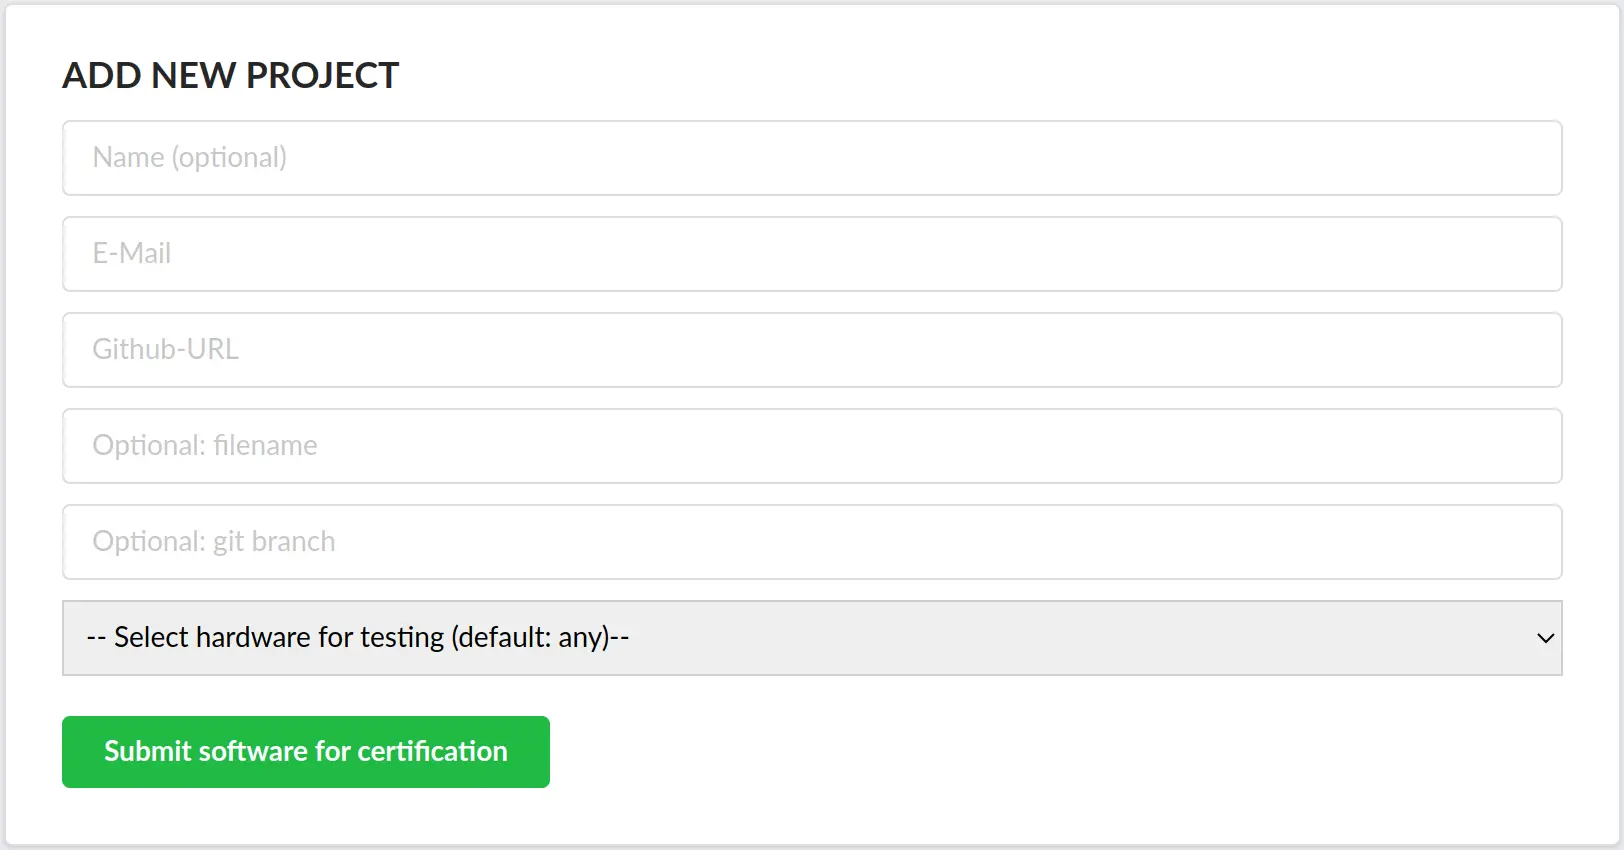
If you have installed a cronjob or run in cluster-client mode → you can insert a new job at http://metrics.green-coding.internal:9142/request.html

It will be automatically picked up and you will get sent an email with the link to the results.
In order for the email to work correctly you must set the configuration in your config.yml.