Title here
Summary here
Configurations in the GMT happen at two central places.
The file based config.yml and the Dashboard based User Settings
The config.yml configures some global measurement settings that are used when
executing the runner.py directly or through cron / cluster-client mode.
Here is an example configuration:
postgresql:
  host: green-coding-postgres-container
  user: postgres
  dbname: green-coding
  password: PLEASE_CHANGE_THIS
  port: 9573

redis:
  host: green-coding-redis-container

smtp:
  server: SMTP_SERVER
  sender: SMTP_SENDER
  port: SMTP_PORT
  password: SMTP_AUTH_PW
  user: SMTP_AUTH_USER

cluster:
  api_url: __API_URL__
  metrics_url: __METRICS_URL__
  cors_allowed_origins:
    - __API_URL__
    - __METRICS_URL__
  client:
    sleep_time_no_job: 300
    jobs_processing: "random"
    shutdown_on_job_no: False
    # These two parameters have only effect in cluster mode. When using CLI they will be set via flags --docker-prune and --full-docker-prune only
    docker_prune: True
    full_docker_prune: False
    # define a workload to check cluster noise floor
    time_between_control_workload_validations: 21600
    send_control_workload_status_mail: False
    control_workload:
      name: "Measurement control Workload"
      uri: "https://github.com/green-coding-solutions/measurement-control-workload"
      filename: "usage_scenario.yml"
      branch: "main"
      comparison_window: 5
      threshold: 0.01
      phase: "004_[RUNTIME]"
      metrics:
        - "psu_energy_ac_mcp_machine"
        - "psu_power_ac_mcp_machine"
        - "cpu_power_rapl_msr_component"
        - "cpu_energy_rapl_msr_component"

machine:
  id: 1
  description: "Development machine for testing"
  base_temperature_value: False
  base_temperature_chip: False
  base_temperature_feature: False


measurement:
  full_docker_prune_whitelist:
    - gcr.io/kaniko-project/executor
  metric-providers:
    linux:
      cpu.utilization.cgroup.container.provider.CpuUtilizationCgroupContainerProvider:
        sampling_rate: 100
      cpu.energy.RAPL.MSR.system.provider.CpuEnergyRaplMsrSystemProvider:
        sampling_rate: 100
      memory.total.cgroup.container.provider.MemoryTotalCgroupContainerProvider:
        sampling_rate: 100
      cpu.time.cgroup.container.provider.CpuTimeCgroupContainerProvider:
        sampling_rate: 100
    # ...

admin:
  notification_email: False
  notification_email_bcc: False
  error_file: False
  error_email: False
The postgresql, smtp and cluster key were already discussed in the installation → part.
Only the following three variables are important for a local installation:
api_url [str]: URL including schema where the API is locatesmetrics_url [str]: URL including schema where the API is locatescors_allowed_orgins [list]: Allowed URLs for CORS requests to the API. It should at least include your chosen api_url and metrics_urlFor the rest please see installation →
If you run locally nothing needs to be configured here.
But if you run a cluster you must set the base temperature values for the accuracy control to work as well as configure the host reservation for CPU and memory.
Please see cluster installation →, accuracy control → and host resource reservations.
Also see Resource Limits to better understand how GMT enforces resource limits on its orchestrated containers.
full_docker_prune_whitelist [list]: A list of image names (without tag) or image IDs (short form) that will be whitelisted when --full-docker-prune is active. Images listed here will not be pruned. Useful for cluster installations where non security critical images shall be kept that take long to download.metric-providers:linux/macos/common [string]: Specifies under what system the metric provider can run. Common implies it could run on either.METRIC_PROVIDER_NAME [string]: Key specifies the Metric Provider. Possible Metric Providers →METRIC_PROVIDER_NAME.sampling_rate [integer]: sampling rate in msSome metric providers have unique configuration params:
Also note that some providers are deactivated by default, because they either need additional configuration parameters, extra hardware or a specially configured system.
Once you have set them up you can uncomment the line. In this example for instance
the line psu.energy.ac.xgboost.system.provider.PsuEnergyAcXgboostSystemProvider and all
the lines directly below it.
The admin key provides no configuration for essential configurations like for instance error handling and
email behaviour if configured
notification_email [str|bool]: This address will get an email, for any error or new project added etc.notification_email_bcc [str|bool]: This email will always get a copy of every notification email sent, even for user-only mails like the “Your report is ready” mail.error_file [str|bool]: Takes a file path to log all the errors to it. This is disabled if Falseerror_email [str|bool]: Sends an error notification also via email. This is disabled if FalseHere you can ignore certain optimizations to not run.
All possible optimizations are found in the /optimization_providers folder of the GMT.
To disable for instance the container_build_time optimization you could set:
optimization:
  ignore:
- container_build_timePlease see for details: SCI →.
If you are using Eco CI or Carbon DB you need to configure Electricitymaps with a valid API token to get carbon intensity data.
The value is a string.
Example:
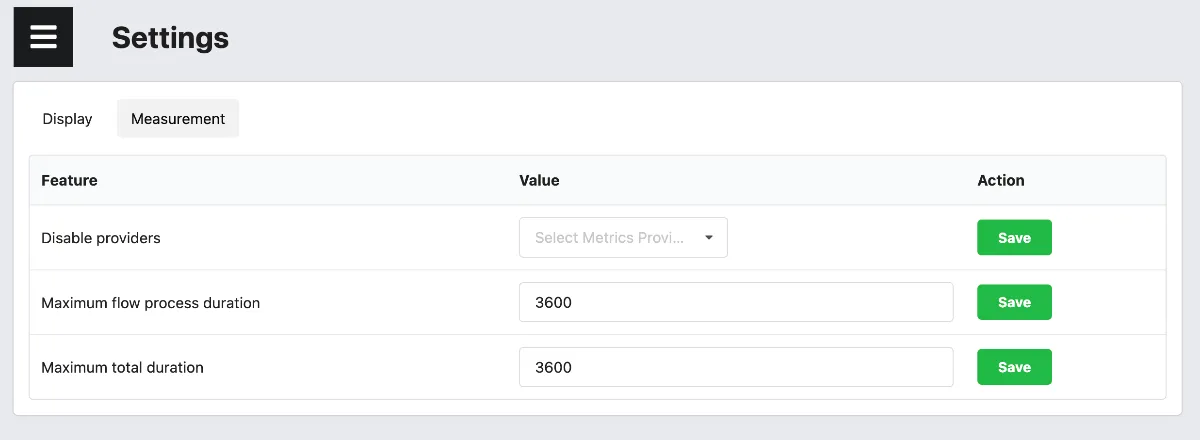
electricity_maps_token: 'MY_TOKEN'Settings that are specifc to a user and apply to all machines that you are measuring on equally are to be configured via the Dashboard. For local installations these are to be found under https://metrics.green-coding.internal:9142/settings.html. If you use our Hosted Service you find it at https://metrics.green-coding.io/settings.html
disabled_metric_providers [list]: Providers to disable in CamelCase format.flow-process-duration [integer]: Max. duration in seconds for how long one flow should take. Timeout-Exception is thrown if exceeded.total-duration [integer]: Max. duration in seconds for how long the whole run may take. Including building containers, baseline, idle, runtime and removal phases.phase-padding [integer]: Phase padding is by default applied to the end of the phase to capture the last sampling tick, which might be cut-off. GMT applies one extra tick to the end of the phase. If your phase cut-offs must me microsecond exact you can turn this off. Typically not recommended and should be left on. See https://github.com/green-coding-solutions/green-metrics-tool/issues/1129 for details.dev-no-sleeps [integer]: Does not sleep in between phases and for cool-down periods. Beware that this will speed up runs on the cluster but render them invalid.dev-no-optimizations [integer]: De-activates running the optimizations after a measurement.