Title here
Summary here
Servers vary greatly in how they perform in terms of energy and cooling. This is quite important for us as temperature
directly interferes with power consumption. A hot CPU takes significant more energy for the same operation as a cool one.
So it is important that we don’t run benchmarks right after each other to give the system time to cool down. For this
we have the base_temperature_value parameter in the config.yml
where you set the temperature the machine must have cooled down to before the next job is started.
To find out this value we have a script tools/calibrate.py in the Green Metrics Tool
repo. On the system that you want to run your benchmarks on
you can execute this script to get the cool down period. The script is called with python3 calibrate.py
You can then either get the script to set the correct value for you or set it yourself.
--dev: Enable development mode with reduced timing.--write-config: Skips the config write dialog and just writes it.--idle-time: The seconds the system should wait in idle mode. Defaults to 5 minutes--stress-time: The seconds the system should stress the system. Defaults to 2 minutes--cooldown-time: The seconds the system should wait to be back to normal temperature. Defaults to 5 minutes--provider-interval: The interval in milliseconds for the providers . Defaults to 2000--temperature-increase: The delta in centi°C the temperature must increase under stress. Defaults to 1000--stress-command: The command to stress the system with. Defaults to stress-ng--log-level: Logging level (debug, info, warning, error, critical)--output-file: Path to the output log file.If the program exits because of an error you can use the return code to see why:
Important values that are extracted:
[INFO] 2026-07-16 09:12:44,317 - System idle measurement successful
[INFO] 2026-07-16 09:12:44,317 - Mean Energy: 3224.33 uJ
[INFO] 2026-07-16 09:12:44,317 - Mean Power: 32.24 W
[INFO] 2026-07-16 09:12:44,318 - Std. Dev: 12.5 uJ
[INFO] 2026-07-16 09:12:44,318 - Std. Dev (rel): 0.39 %
[INFO] 2026-07-16 09:14:02,905 - Peak system energy is: 9871.5 uJ
[INFO] 2026-07-16 09:14:02,905 - Peak system power is: 98.72 W
[INFO] 2026-07-16 09:14:02,906 - Effective energy overhead (rel.) is: 1.83 %
Please remember that all values are stored as integers in the database. Temperatures are therefore multiplied by 100 and stored as centi°C, while energy is multiplied by 1,000,000 and stored as micro-Joules.
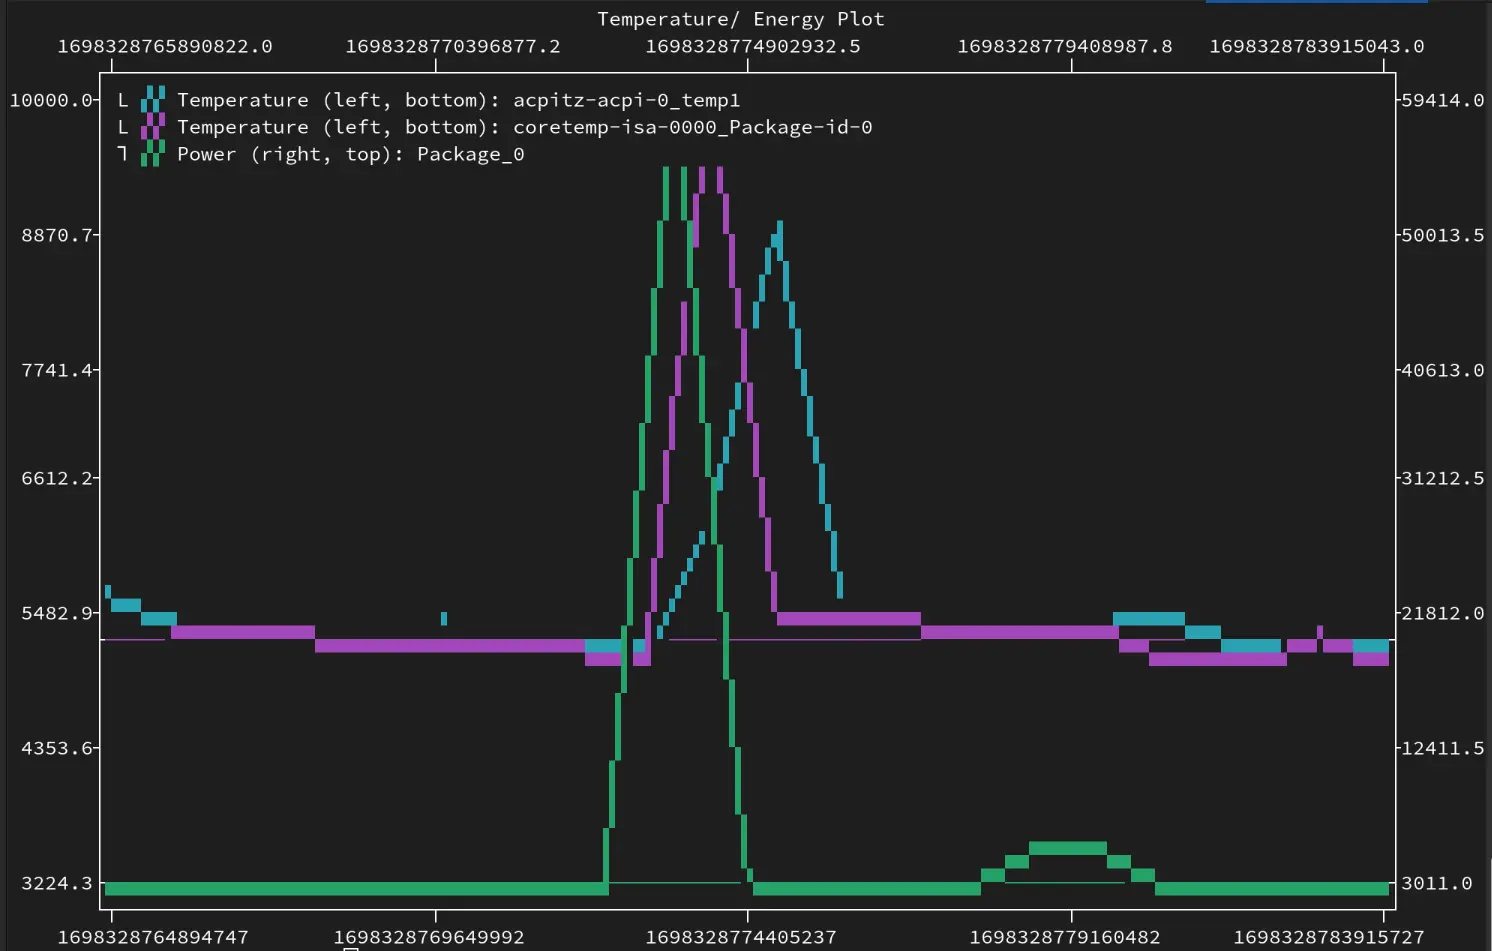
For now this is only relevant for temperature cool downs. We already collect energy data so that in the future we can use this to check if the system is currently running idle when starting the GMT. Also we can use the tool to benchmark new metric providers and see how much overhead they create.